 The 3rd Quarter eThekwini Metro FNB Residential Property Barometer pointed to a further jump in activity levels in the region for the 5th consecutive quarter, after a very low bottoming out point in the 2nd quarter of last year. This suggests that the region is beginning to feel the positive impact of the series of interest rate cuts that took place in the 1st half of 2009. The Property Barometer is a survey of a sample of estate agents in the major cities of the country regarding their personal experience of market conditions.
 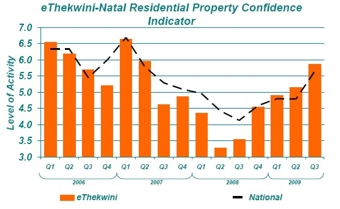 The main Barometer question relates to the level of demand activity, and agents are asked to rate the level of demand that they experience on a scale of 1 to 10. After an initial rise to 5.14 in the 2nd quarter of this year, from 3.27 in the 2nd quarter a year ago, agents estimated the activity rise to have sped up a bit more to 5.86 in the 3rd quarter. The 3rd quarter survey was undertaken in mid-August, after the bulk of the SARB’s 2009 interest rate cuts to date. eThekwini survey respondents surveyed are the most upbeat of the major regions
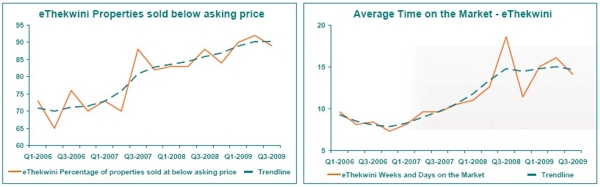
 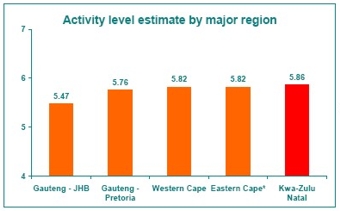 The steady rise in the eThekwini’s activity rating means that the agents surveyed from that region are more upbeat about activity than any other of the major metro regions surveyed, especially compared with their Gauteng counterparts, although all regions have seen an improvement. The 3 major coastal metros, namely eThekwini (5.86), Mandela Bay (5.82), and Cape Town (5.82) are now more upbeat in their estimates of activity compared with Joburg’s 5.47 and Tshwane (5.76). Widespread lack of seller realism still prevalent, but change may be looming The estimated percentage of properties sold at below asking price showed a slight decline from 92% in the 2nd quarter to 89% in the 3rd quarter, while the average time of a property on the market prior to being sold declined from 16 weeks and 1 day in the 2nd quarter to 14 weeks and 1 day in the 3rd. These two indicators, when read together, point towards the possible start of more realistic pricing by sellers. The greater realism may not only be due to sellers setting prices lower, but also due to the market catching up to price levels, therefore making previously unrealistic price levels now a little more realistic in a stronger market.
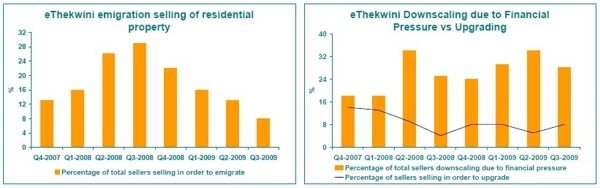
Reasons for selling property in eThekwini
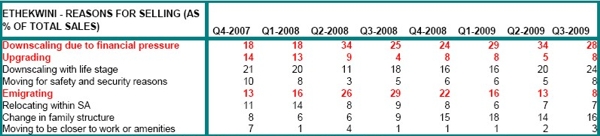
Selling in order to downscale due to financial pressure declined slightly in importance, dropping from 34% of total selling to 28% from the 2nd quarter of 2009 to the 3rd. Simultaneously, selling in order to upgrade rose slightly from 5% of total selling to 8% over the same period. These are not major moves, but it is believed that this might well be the start of a trend towards better numbers, with the interest rate cuts to date expected to have a more significant impact in terms of alleviating the pressure on households as a whole. As a percentage of total selling, emigration selling in Durban showed a massive surge during 2008, similar to the trend in other metros, but seemingly more extreme than the likes of the Gauteng metros or Cape Town. After a peak of 29% in the 3rd quarter of 2008, there has been a broad decline in emigration selling’s significance to only 8% of total selling by the 3rd quarter of this year, according to the estate agents surveyed.
Main eThekwini Metro Price Trend estimates (using Deeds data) still pointed to oversupplies and widespread price deflation in Q2 2009 Despite some improvement in residential demand in recent times, oversupplies on the market were still significant as at the 2nd quarter (Deeds data running a bit behind), resulting in widespread price decline continuing across much of the eThekwini region. This can be expected to start turning for the better in the numbers for the 2nd half of the year.
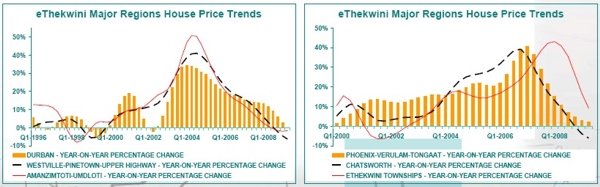
The Durban area, including Umhlanga/Mount Edgecombe in the North, Durban Central, and Isipingo to the South, (avg. price = R860,976) showed 0% price change year-on-year (y/y) in Q2 2009, down from 2.8% in the previous quarter’s revised number.
The Westville-Pinetown-Upper Highway region (avg. price = R916,470) showed price deflation of -6.2% y/y in the 2nd quarter, a deterioration from -4.5% in the previous quarter. Bordering Durban to the North and the South, the 2 coastal towns of Amanzimtoti and Umdloti (avg. price = 1,014,353) showed a deflation rate of -1.6% y/y in the 2nd quarter, a deterioration from -1.9% previous.
Traditionally strong Indian areas have been showing similar weakness to the former white areas. The Phoenix-Verulam-Tongaat region (avg.price = R385,323) showed 2% price change y/y, while Chatsworth (avg. price = R405,528) experienced 2nd quarter price decline of -6% y/y.
eThekwini’s former Black Townships (avg price = R242,240) still showed the best price inflation of all of the regions, to the tune of 9.2% y/y in the 2nd quarter, but the rate of deceleration is now rapid, with the rate having declined from the previous quarter’s 16.7%.
Interpretation/Conclusion Although not expected to be a strong recovery, the 3rd quarter Barometer points to significantly stronger situation in the eThekwini Metro residential market compared to a very low activity rating last year. This metro appears to be more sensitive to economic and interest rate cycles than some of the others, perhaps due in part to its dependence on the highly-cyclical manufacturing sector. Therefore, from a situation in the 2nd quarter of last year, where at one stage the metro’s agents surveyed were the least optimistic in the country, the situation has steadily turned to a state where they are now seemingly the most upbeat (albeit very close to other coastal metro agents). The 3rd quarter jump in demand was significant, while other key indicators such as average time on the market and percentage of sellers achieving their asking price also look like starting to improve. Deeds data runs a bit behind, and still shows widespread price deflation as at the 2nd quarter, but this is expected to change for the better in the numbers for the 2nd half of 2009, tracking the national trend back towards price inflation. To date, the market improvement is largely the result of interest rate cuts, and banks’ responses to better market conditions by relaxing lending criteria has reinforced the trend. In the near term, though, the economy is expected to provide more support for the market as we emerge from recession.