|
Price deflation now steadily diminishing as market continues its moderate recovery
FNB House Price Index Starting To Show Stronger Signs Of Market Improvement
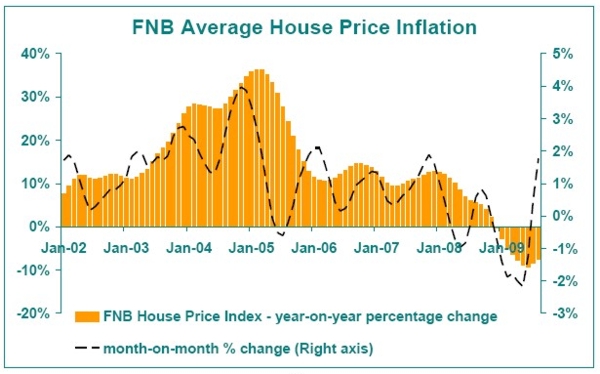
The FNB House Price Index’s year-on-year decline continued in August, but for the 2nd successive month we saw a diminishing price deflation rate, with the index starting to show clearer signs that the market is starting to stabilise. On a year-on-year basis, the index declined by -7.4% in August, a significant improvement on the revised -8.5% deflation rate for July.
On a month-on-month basis, although we haven’t seasonally adjusted the series, the rate of increase has become too significant to merely write off as seasonal factors, with the August month-on-month rise amounting to 1.8%.
The improving trend comes some time after estate agents surveyed in FNB’s Residential Property Barometer began reporting moderately strengthening demand levels back in the 4th quarter of 2008, but the reason for the index taking so long to get out of price deflation has been a significant oversupply of property on the market relative to demand, with many households having to sell properties due to financial stress.
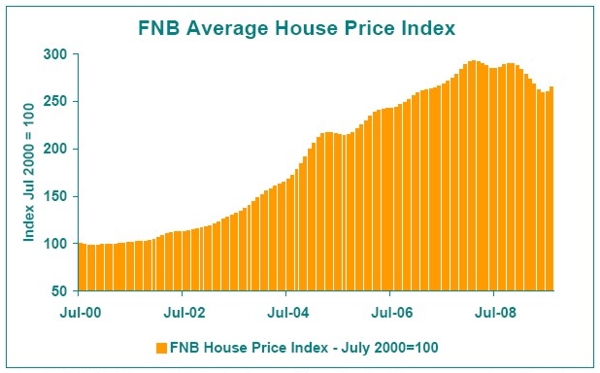
The FNB Price Index has July 2000 as its base month, i.e. July 2000 = 100. The latest index value (August 2009) was 264.7, implying an average value still 164.7% higher than the price average measured in July 2000 when the time series started. However, from the peak in the index reached in February 2008, the August value is -9.6% down.
Comment – recovery supported heavily by interest rate cuts to date, but the economy may also be starting to come to the party in a small way
Until the present time, we believe that the mild property market recovery being witnessed has been overwhelmingly driven by interest rate cuts, with little help from an economy languishing in recession. The pressure that the economic slump has exerted on household income has been severe (1st quarter real disposable income declined at an annualised rate of -4.5%), and as a result the household debt-to disposable income ratio remains near historic highs despite slowing credit growth.
Nevertheless, despite no meaningful decline in household indebtedness, the household debt service ratio (the cost of paying interest + capital on debt expressed as a percentage of disposable income) has been declining during 2009 due to an interest rate decline totalling 500 basis points, and this has significantly alleviated the strain on the household sector.
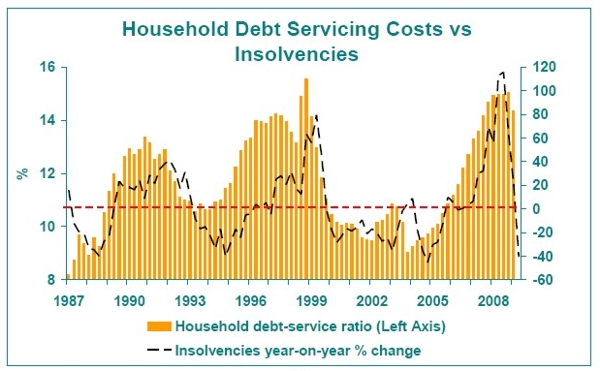
This has supported the start of declining arrears levels for FNB (and one would imagine that other banks would see a similar picture emerging), and one can now see a sharp decline in insolvencies statistics, with second quarter insolvencies down by about -40% year-on-year.
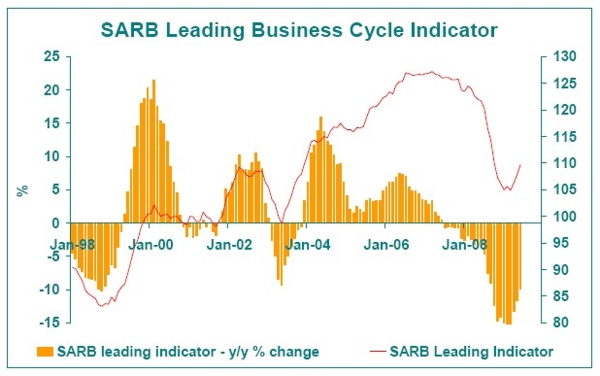
Very recently, certain economic numbers have suggested that the housing market may well begin to get a little support from the economy, with the South African Reserve Bank’s Leading Business Cycle Indicator having begun to turn upward early in the year. In addition, the severity of the negative real economic growth moderated in the 2nd quarter, with a -3% annualised real GDP decline slightly better than the -6.4% of the previous quarter.
However, it is important to realise that the economic growth indicators remain very weak despite some improvement, and given the high levels of indebtedness both in South Africa and in the USA, the expectation remains that the economic and property recovery over the next year or so will be moderate at best.
Therefore, while it is believed that the country’s property market looks set to move back into price inflation early in 2010, the expectation is that 2010 will see single digit house price inflation and probably little if any “real” house price inflation, i.e. house price inflation which outstrips consumer price inflation.
|