FNB House Price Index now very near to resuming year-on-year inflation The FNB House Price Index’s year-on-year decline continued to diminish at a steady pace, and it looks likely that year-on-year price increase will resume in the next few months. The deflation rate for September was -4.4% year-on-year, significantly less than a revised August rate of -6.5%. At this rate, year-on-year deflation will probably be a thing of the past before year-end. 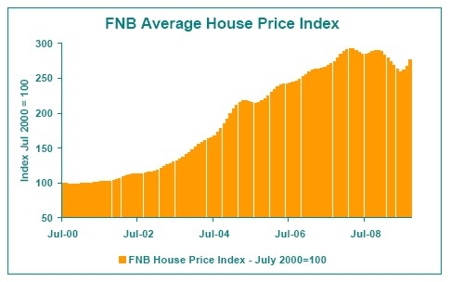 This diminishing price deflation trend is a strong sign that the positive impact of 500 basis points’ worth of interest rate cuts since December 2008 is starting to be felt in terms of residential market performance. It is becoming clearer that the recent months’ diminishing price deflation is indeed the start of a trend back towards price inflation, following on an improving trend in demand and transaction volumes, which started earlier in 2009. The improvement in the market to date has been very much due to interest rate cuts, which have improved the household sector’s ability to service debt. However, there has been no real help from the economy, which remained in recession until very recently, exerting huge pressure on household disposable incomes.
  The improvement in the market has not only been seen in volume of transactions and diminishing price deflation, but also in an improvement in credit quality. FNB has seen home loan arrears numbers improving, while 2nd quarter insolvencies were down by -40% year-on-year. The FNB Price Index has July 2000 as its base month, i.e. July 2000 = 100. The latest index value was 275.6, implying an average value 175.6% higher than the price average measured in July 2000 when the time series started. However, from the peak in the index reached in February 2008, a cumulative price decline of -5.9% has been recorded to date. Market Segments – “2 Bedroom And Less” Segment Still Weaker Than the 3 Bedroom Segment But Showing Signs of Improvement
  We remain of the belief that the smaller “2 bedroom and less” market segment should be more cyclical over time than the 3 bedroom market. This is because the smaller-sized segment is more the target of first time buying as well as buy-to-let buying, more cyclical demand types than the established family demand which would probably dominate in the 3 bedroom market. The most recent quarterly house price numbers expressed according to number of bedrooms still appear to support this view. In the sectional title market, the 3 bedroom segment showed year-on-year price inflation of +0.1% in the 3rd quarter, still slightly better that the 2 bedroom and less segment’s -0.5%. However, the 2 bedroom and less segment appears to have been turning already, reflecting its greater sensitivity to cyclical changes, while as yet the 3 bedroom segment still shows weakening price inflation.
 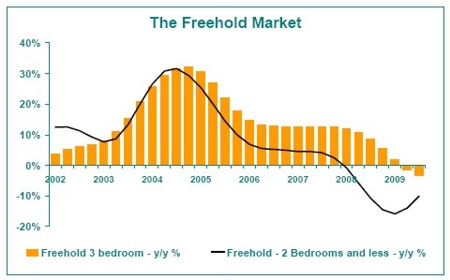 In the freehold market, too, year-on-year price deflation of -10.1% in the 2 bedroom and less segment is far worse than the -3.5% recorded in the 3rd quarter for the 3 bedroom segment. But again, the 2 bedroom and less segment has shown improvement for a few quarters already (diminishing price deflation), while the 3 bedroom segment still points to deterioration. In both the freehold and sectional title markets, therefore, it would appear that although the 2 bedroom and less segments still appear to be weaker to date, it is these smaller-sized segments that appear to be responding first to the declining interest rate cycle. Conclusion The September house price numbers represent the 3rd consecutive month of diminishing house price deflation, suggesting that an improving trend has indeed been established, and that by year-end we may have seen the last of year-on-year house price deflation for the time being. There has been an increase in residential demand in recent times, mostly driven by a series of interest rate cuts. However, this strengthening in demand has been slow and moderate, because against interest rate cuts the country has had the spectre of declining real household income, caused by the combination of job loss, deteriorating discretionary remuneration, and weaker investment income flows to households in tough economic times. Therefore, as yet it would not appear that oversupplies of property on the market have been entirely eliminated. With regard to the economy, there have been some early signs of levelling out, with the SARB Leading Business Cycle Indicator starting a rising trend during recent months after a major decline in 2008. It is conceivable that economy-wide production could be showing some signs of stabilising, and that the 3rd quarter may have seen the end of the recession. However, we continue to emphasise that the platform off which the USA hopes to launch its economic recovery doesn’t appear very stable, with that country’s various debt and debt-service ratios still at or near the highest levels in history. In SA, too, the household debt to disposable income has made little downward progress, due to incomes being under huge pressure and making debt reduction slow going. Realistically, therefore, while we expect to see a move back to house price inflation in 2010, the expectation is that average price inflation for next year will be moderate at around 5%.
Property Advice