Although it has not yet regained its shine as an investment, the attractiveness of residential property as an investment does appear to be gradually improving. This is the view of John Loos, Household and Consumer Sector Economist at FNB, and Michelle Dickens, Managing Director of TPN (Tenant Profile Network) Credit Bureau.
“While the average home owner appears to place much emphasis on the value of his or her property, when it comes to property as an investment it is actually the income stream that it generates, relative to the price paid, that should really be the focus”. So, says Dickens, “In investorspeak, a far better number to focus on would arguably be the “initial yield”, i.e. the income expected to be earned over the next year divided by the property value”.
Loos adds that it is therefore somewhat ironic that, when we discuss house price performance in recent years, many see it as a depressing picture. “However, weak house price growth that underperforms rental income growth is actually what is required to improve the attractiveness of property as an investment in future, through leading to a higher yield.”
Dickens and Loos have long since agreed that, while South Africa has a wealth of house price data, we are sorely lacking when it comes to estimates of yields on property. So, TPN has a wealth of rental data, while FNB has the house price data and Automated Valuation Models (AVMs) required to undertake such estimates, and the two have thus teamed up to produce the FNB-TPN Residential Yield dataset.
The methodology
In short, the approach has been to take all of the properties for which TPN rental data exists, utilise the AVM to estimate a current value on the property, and then to calculate the initial yield on all such properties.
After including a few “data cleaning filters”, the estimates of initial yields on residential properties have been produced. Loos explains that “because rental variations appear to vary far greater from the mean than house prices do (possibly due to the absence of professional valuer guidance in the rental market), we find it better to use median yields than average yields. The national average yield is therefore a combination of mean and median, representing the weighted average of the median yields of the six main housing market sub-segments.
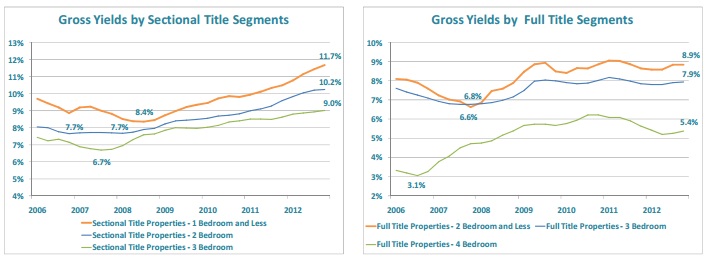
These six sub-segments include Sectional Title 1 Bedroom and Less, Sectional Title 2 Bedroom, Sectional Title 3 Bedroom and More, Full Title 2 Bedroom, Full Title 3 Bedroom, and Full Title 4 Bedroom and More.
The data

“Looking at the data of the FNB TPN National Average Initial Yield on Residential property”, Loos says, “the boom era yield decline (compression) ended in December 2006, when the average gross initial yield bottomed out at 6.655%. This yield compression was driven by rapid house price growth in last decade up until 2006, and good growth in the availability of properties to rent, driven by strong buy-to-let buying, which kept the rental market relatively subdued. This implied that property investors had to pay more and more for the same rental income stream, i.e. residential property was steadily becoming a less attractive investment up until late-2006.
Thereafter, however, ongoing rental inflation in some form, coupled with a steady decline in house price growth, led to a gradual rise in average initial yield to 8.58% as at November 2012.”
Loos does emphasise, however, that these yields are still gross yields, meaning that landlord operating costs associated with the property have not yet been included in the calculation to get to a net initial yield. “That”, he says, “is still work in progress. Nevertheless, to have gross yield data is a major step forward for us, as the house price picture only gives part of the picture around property market performance and attractiveness.”
How attractive is an 8.58% gross initial yield? “This is debatable, but it is significantly better than the 2006 low. However, I would venture to say that this is not yet highly attractive yet. Rode and Associates suggest that as a rough estimate one can take 1.5 percentage points off the gross yield to estimate a net yield. If one were to do this, it would leave the net yield at around 7.08%. Such a yield would, for many, still be below the cost of finance, given a prime rate of 8.5%”.

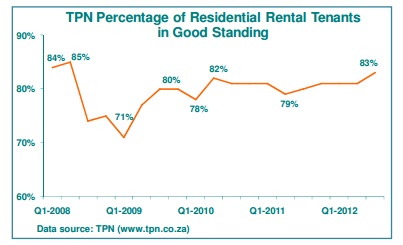
“On top of that”, says Dickens, “according to the TPN tenant payment data, although tenant payment performance has improved since the 2008/9 recession, 17% of tenants were not in good standing in terms of their rental payments to landlords as at the 3rd quarter of 2012, so an investor would probably be looking for a yield that compensates for the still significant risk associated with buying to let property.”
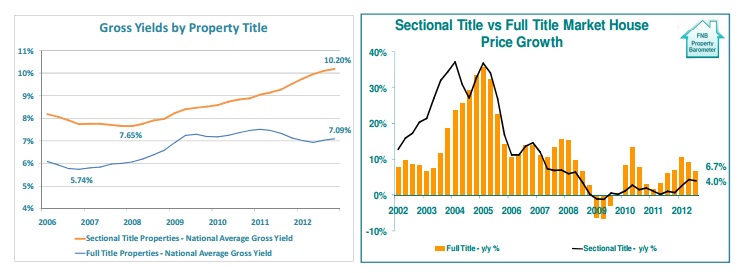
Which segments have the best yields? “Those which have been less popular for home buyers in recent years, it would seem”, says Dickens. “Since 2010, it would appear that the better house price growth has been in the Full Title Segment. And so we find that Sectional Title Segment gross yield at 10.2% has widened the gap on Full Title’s yield of 7.09%.

“And smaller is generally better in terms of yields”, says Loos, with the sub-segments with less bedrooms generally showing higher yields than the larger and on average more pricey homes.

Therefore, it is a lack of enthusiasm, and perhaps a lack of finance, in these tough economic times, that is driving the slow recovery in attractiveness of residential property as an investment, says Dickens. “By this I am referring to indications that buy-to-let house buying is slow”. Loos concurs. “The latest FNB Estate Agent Survey for the 4th quarter of 2012 shows buy-to-let buying estimated at a mere 7% of total home buying. This is a shadow of the glory years around 2004, where at a stage the percentage reached 25%.” But this slow pace of buy-to-let buying is “just what the doctor ordered”, constraining the growth in homes available to rent. And, says Dickens, “while the rental market is certainly not setting the world alight, at 3.6% year-on-year national average rental growth in November 2012, rental inflation still outstripped the 0.5% year-on-year November FNB House Price Index growth, helping yields to continue to gradually rise.

And so, for 2013, what do the two foresee? “More of the same”, they agree, with mediocre rental inflation in a weak economy still managing to beat even weaker house price growth by a small margin, translating into further rise in the national average gross initial yield on residential property.
Their hope is that improving the quality of rental and yield data, and ultimately the ability to calculate total returns on property, will lead to a better understanding of the performance of residential property as an investment, and less of a “perhaps misplaced” focus on price growth alone.
John Loos, FNB Household and Consumer Sector Strategist
Tel: 011 649 0125; Cell: 083 453 8096; Email: john.loos@fnb.co.za
Michelle Dickens, Managing Director: TPN
Tel: 0861 876 000; Cell: 082 905 7099; Email: michelle@tpn.co.za


