2016 was a tumultuous year globally and in South Africa. Internationally, seismic events like Brexit, a refugee crisis and the election of a controversial American president have seen uncertainty spread across markets.
In South Africa, consumer confidence waned as rising living costs, political uncertainty and the worst drought in years took their toll. In spite of all this, the property market in South Africa showed remarkable resilience and activity levels. In 2016, property worth more than R695 billion was added to the Private Property website.
Growth was muted with the price of property coming to market showing a year on year price increase of just 2% or R30 000 nationally, for Q4.
“Low price growth has implications for both buyers and sellers”, says Simon Bray, Private Property’s CEO. “When prices rise slowly, overpriced property stands out for offering poor value and does so for longer. With affordability a major concern for buyers, sellers need to be aware of the dangers of overpricing their homes and putting off buyers.”
“For first time buyers, slow price growth is a good thing because it means they won’t need to borrow much more now than they did at this time last year – and that their monthly bond repayments won’t be that much higher,” he added.
Growth of just 2% nationally does not however show the full picture. A closer look at the data shows that within the country there are still pockets of high growth in some property types and areas.
National asking price movements by property type
The median asking price for property across South Africa was R1 420 000 and the market as a whole showed YOY price growth of 2%. A noticeable trend in the South African property market in recent years has been a trend towards downsizing. Buyers are choosing smaller properties like flats and townhouses due to lower prices, lower buying and maintenance costs, and for security considerations. These smaller property more often than not, have the added convenience of being located close to city centres, making for easier commuting. With greater demand it is perhaps unsurprising that these smaller property types have shown the highest asking price growth.
The median asking price for flats was R850 000, which grew by 8% or R60 010. Townhouses, which had a median asking price of R1 170 000 grew by 9% or R100 000. Houses, which had a median asking price of R1 650 000 grew by just 1% or R15 000. 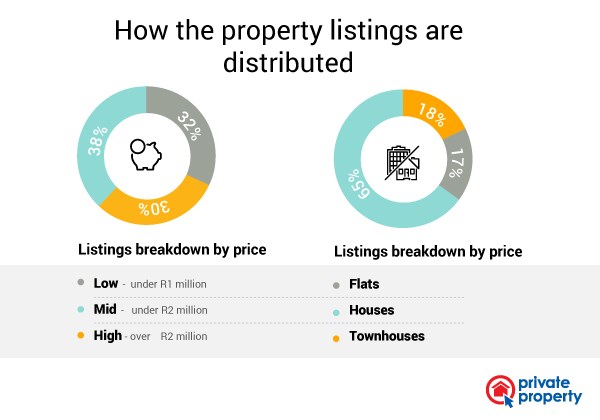
Provincial Overview 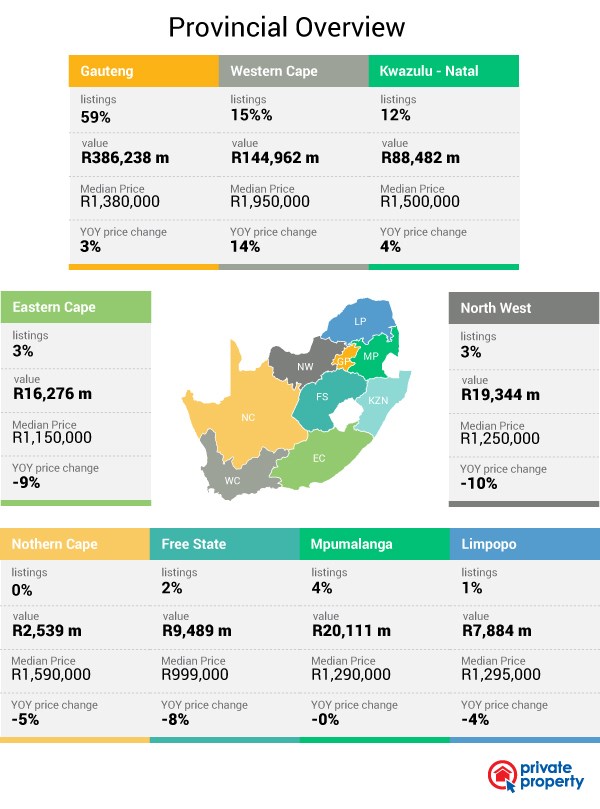
Metro Level Analysis
The bulk of South Africa’s property market activity is concentrated in the five biggest metros (by population) of Cape Town, eThekwini, Johannesburg, Tshwane and Ekurhuleni. Sixty nine percent of listings and seventy three percent of the total property value is concentrated in these five metros.
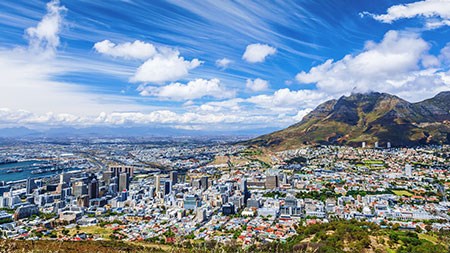
Comparison per metro of median prices and YOY change Cape Town has been the star performer in the South African property market for a while and this metro boasts the highest median price and price growth. The area has long been popular amongst both semigrants and foreign buyers who are attracted by the lifestyle, perceived good governance, and the attractiveness of the property market. The fact that they city is land constrained adds to the high demand and high prices for property in the area.
The eThekwini region boasts the second most expensive median prices and second highest price growth. The relatively high prices can largely be attributed to upmarket areas to the north of the city, like Umhlanga.
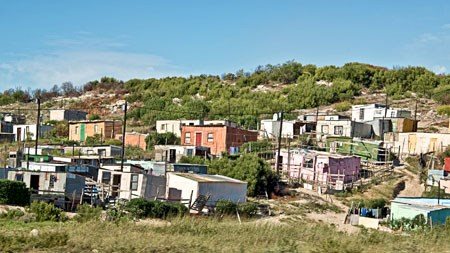
Interestingly, Ekurhuleni ties with Durban for second highest price growth of six percent. The fact that this metro also has the lowest median price is indicative of the fact that the affordable property available here is a magnet for buyers and first time buyers in Gauteng.
There was no growth in asking prices in Tshwane and areas outside of these 5 metros, while Johannesburg experienced a decline of 3%.
 Metro level analysis
Sizing up the metros
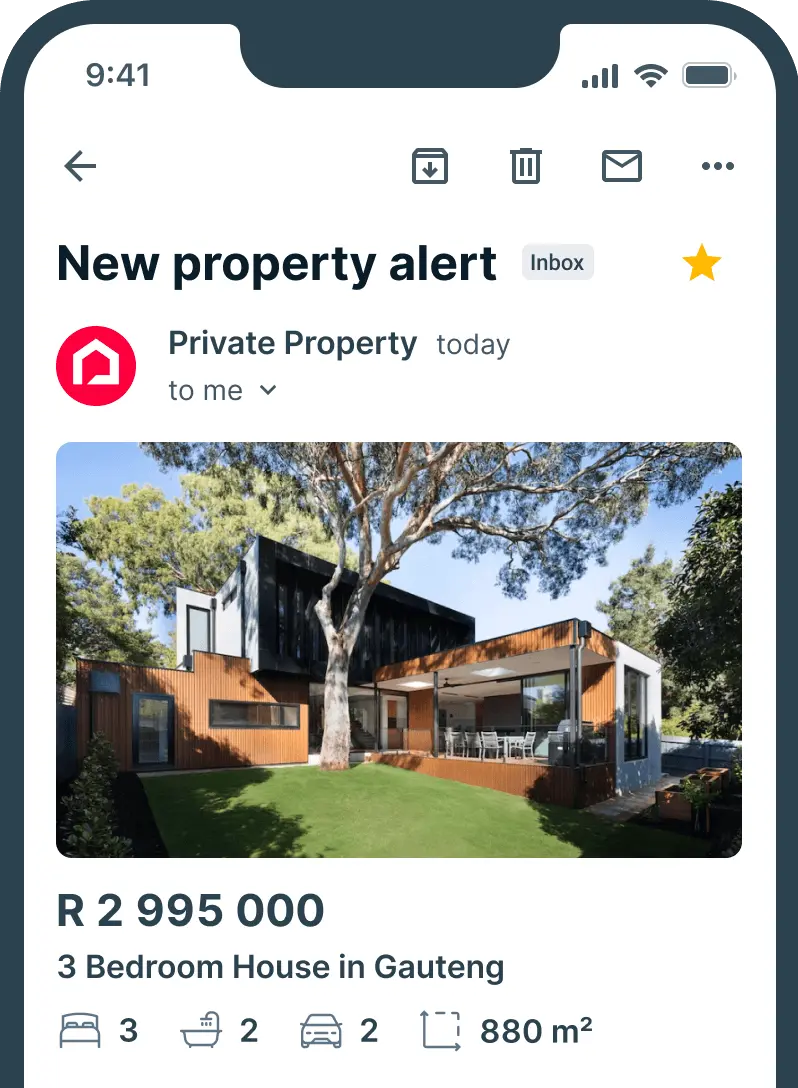
Home buyers in Gauteng looking for space should be heading for Tshwane. With a median size of 202 square metres, property in Tshwane is bigger than any of the other metros areas. With plenty of available land, there is little need for densification and developers are able to build on larger plots. With this in mind, it is not surprising that our data shows that Tshwane also has the largest proportion of “large’ homes.
Property in the eThekwini metro has the smallest median size at 125 square metres. With a large proportion of the property in high density areas like the Berea and Umhlanga Ridge, eThekwini has the largest proportion of ‘small’ homes (48%).
Property sizes in the other metros are under the national median of 165 square metres and are very much dependent on the distribution of small, medium and large homes within these metros.
 Metro sizes
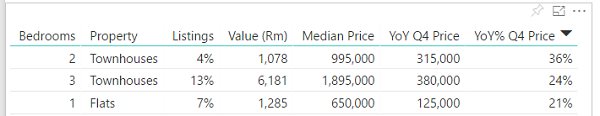
Biggest growth by property type
Within each metro, some property types have outperformed the rest. Looking at the top 3 performing property types in each of the metro confirms the shift towards smaller sectional title type properties with flats and townhouses dominating the lists. This is a trend that will continue as affordability, running costs and security remain at the forefront on South African property buyer’s minds.
Cape Town

Ethekwini
Ekhuruleni 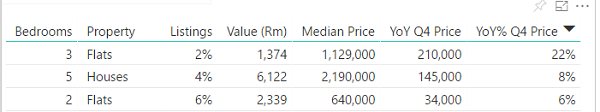
Johannesburg 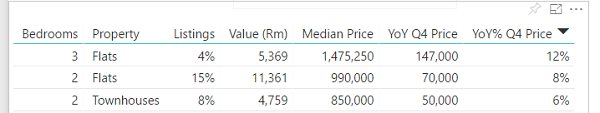
Tshwane 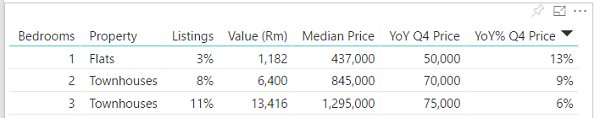
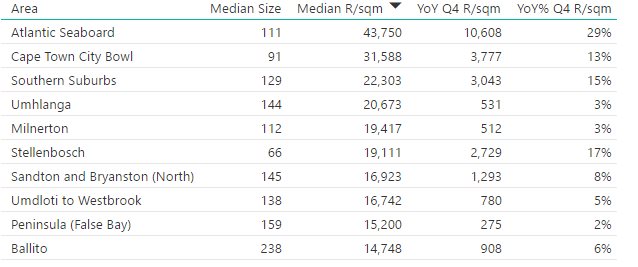
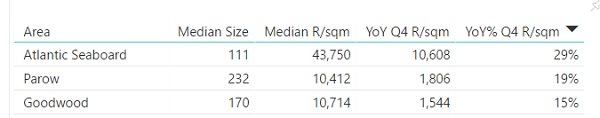
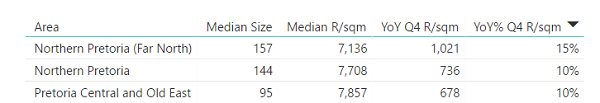
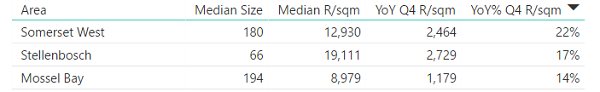
Areas that have shown the biggest growth per square metre
Cape Town has been regarded as the star performer in the South African property market in recent years with house price growth in the region soaring. The Atlantic Seaboard showed the highest growth of 29% per square metre. Interestingly, the next highest growth per square metre in the metro is in the more affordable (by Cape Town standards) areas of Parow and Goodwood.
In the Ethekwini metro, the top 2 areas in terms of price growth per square metre were Hillcrest and Kloof – areas where buyers get more ‘bang for their buck’ in terms of property size, and a village-like lifestyle within a 20-minute drive from the Durban CBD.
In the Gauteng metros, growth has been muted with Bedfordview, and the affordable Northern Pretoria market performing best. Outside of the 5 main metros, it is areas in the Western Cape that dominate with Somerset West and Stellenbosch showing large price increases.
Cape Town – 5% YOY Change per square metre
Ekurhuleni – 3% YOY change per square metre 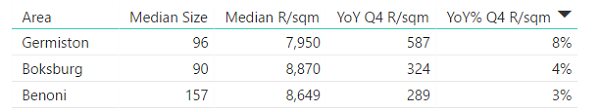
eThekwini – 7% YOY change per square metre 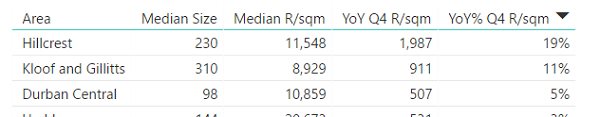
Johannesburg – 7% YOY change per square metre 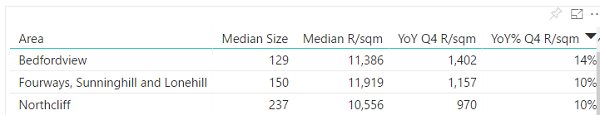
Tshwane – 2% YOY change per square metre
Area outside of the main metros – 8% YOY change per square metre
Most expensive areas in South Africa
Below are the 10 most expensive areas in South Africa.