|
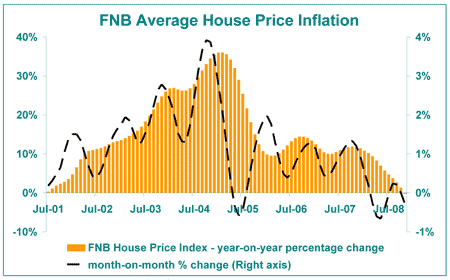
The FNB House Price Index continued its declining year-on-year percentage change trend in November, to record its first month of average price deflation by this measure to the tune of -0.2%. This is significantly worse than the +1.3% revised year-on-year inflation rate of October. On a month-on-month basis -0.3% deflation was recorded, down from zero percent in the previous month.
|

|
|
The start of recorded national price deflation does not come as a surprise, given the myriad of negative factors that have been steadily mounting against the residential market.
With 11 months of the year past, it would appear that the average price inflation rate for 2008 as a whole will be in the region of 5%, representing the fourth consecutive year of slowing average price growth since the peak of the boom in 2004.
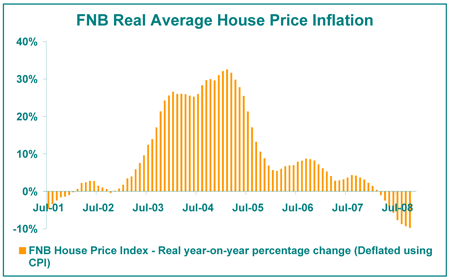
In real terms, October was -9.8%, worse than the -9.3% of the previous month despite some decline in CPI inflation last month.
|
|
The rate of real price deflation may be curbed in the near future, as the consumer price inflation rate has started to decline over the past 2 months and this looks set to continue. From 13.7% in August, the year-on-year consumer price inflation rate has declined to 12.1% in October and more decline is foreseen.
|

|
|
OUTLOOK
2009 is expected to be a year of apparent contradictions in the sense that average price change for the entire year could be significantly worse than 2008, and could average deflation, but yet 2009 is expected to be a year in which significant improvement is witnessed in the residential market as the year progresses.
This, however, is not necessarily the contradiction that it appears to be. Rather, it is a case of having to split the year up into segments. 2009 looks set to start in a situation of average house price deflation along with very weak residential demand, an overhang of the very weak demand conditions that we have experienced this year.
However, the inflation outlook for the country has improved dramatically (declining consumer price inflation) due to a sharp drop in global commodity prices. This looks set to bring about a two-pronged stimulus for the market, the first one in the form of less downward pressure on real disposable income from sharply rising prices, and the second one in the form of setting us up for seemingly imminent interest rate cuts. The first interest rate cut in an expected series could be as early as next week, and if not then early next year.
This in turn is expected to lead to a gradual pick-up in both residential and new mortgage demand as the year progresses. However, the recovery in residential demand should be slowed by very weak economic growth and potential further job losses early in the year, as the economy still battles the effects of the global crisis as well as lagged impacts of the recent period of high interest rates, so one shouldn’t expect fireworks.
In addition, there is something of a lag between a change in demand and the response from year-on-year house price inflation. It is thus expected that changes in prices may only return to positive growth territory very late next year. Hence, the expectation of average price deflation in the FNB House Price Index of -3 to -5% for 2009 as a whole, despite residential demand conditions improving gradually as the year progresses.
Once again, the big unknown factor, which presents a major “downside risk” to the local economy, and thus to local residential property, is the extent of the global financial crisis and its impact on global economic growth. Are we only at the beginning of it or are we near the end? One can’t pretend to have an accurate answer to this question as yet, and so the risks remain high at the present time. Fortunately SA’s high interest rates give it some ammunition (in the form of looming rate cuts) with which to cushion the blow, while lower commodity prices will provide some additional support to the global economy through these troubled times.
|
The FNB House Price Index is constructed* using the average value of housing transactions financed by FNB. In order to eliminate outliers from the data sample, transaction values must be above 70% of FNB Valuations Division’s valuation of the property but below 130%, while purchase prices recorded as above R10m. In order to reduce the impact on the index of rapid short term changes in weightings of different property segments, due to relative shifts in transaction volumes, the weightings of the different market segments according to room number are kept constant at their 5-year average weighting. A statistical smoothing function is applied to the data.
*data compiled by Ewald Kellerman and John Loos, FNB Home Loans
|


